Measuring customer engagement is an essential practice for businesses looking to connect with their customers effectively. By tracking and analyzing customer engagement metrics, you can evaluate the success of your efforts and make data-driven improvements to enhance customer satisfaction and loyalty.
In this article, we will explore four key customer engagement metrics that every business should track. Understanding the importance of these metrics and implementing effective measurement strategies will help you optimize your customer engagement and drive your overall success.
Conversion Rate
The conversion rate is a fundamental customer engagement metric that measures the percentage of people who complete a desired action tied to a campaign goal. This action can vary depending on the campaign, such as downloading an eBook, signing up for a newsletter, or clicking on an ad.
Calculating the conversion rate is simple, as it involves dividing the total number of conversions by the total number of visitors or sessions and multiplying by 100. Many marketing automation software tools can automatically calculate conversion rates.
Monitoring and improving the conversion rate is essential for evaluating the effectiveness of campaigns and optimizing customer engagement.
Measuring, calculating, and tracking the conversion rate allows you to gauge the success of your campaign goals and make informed decisions about your marketing strategy. By understanding how well your campaigns are driving desired actions, you can optimize your efforts to improve customer engagement and ultimately boost your bottom line.
Pages per Session
Pages per session is a crucial customer engagement metric that can provide valuable insights into user engagement and website performance. This metric measures the number of pages a user clicks through during a single visit to your website. A higher pages per session rate indicates that visitors are finding your content helpful, authoritative, and engaging.
There are several factors that can influence pages per session and contribute to higher user engagement. One important factor is website navigation. A well-structured site that is easy to navigate encourages visitors to explore more pages. By ensuring intuitive navigation and clear calls-to-action, you can guide users to relevant resources and increase their pages per session.
Internal links also play a crucial role in increasing pages per session. By strategically placing links throughout your content, you can direct users to related articles, blog posts, or other relevant pages on your site. This not only enhances user experience but also encourages users to delve deeper into your content, ultimately increasing their engagement.
In addition, the quality of your content plays a significant role in driving pages per session. High-quality and relevant content keeps visitors interested and encourages them to explore more pages. By providing valuable information, actionable insights, or entertaining content, you can capture their attention and encourage them to click through to additional pages.
To track pages per session, you can utilize Google Analytics or other web analytics tools. These platforms provide comprehensive data on user behavior and engagement metrics, including pages per session. By regularly monitoring this metric, you can gain insights into the effectiveness of your website and make data-driven decisions to optimize user engagement.
“Pages per session is an important metric that reflects the level of user engagement on your website. By understanding the factors that influence this metric and tracking it regularly, you can make informed decisions to improve user experience and drive higher engagement.”

Net Promoter Score® (NPS)
Net Promoter Score (NPS) is a widely recognized and valuable customer engagement metric that measures customer loyalty and their likelihood to recommend a brand to others. This metric enables businesses to understand and evaluate the level of customer satisfaction and loyalty they have achieved. By assessing customer sentiment and feedback, companies can identify areas for improvement and take actionable steps towards enhancing customer loyalty and satisfaction.
To measure NPS, businesses typically conduct surveys that ask customers to rate their likelihood of recommending the brand on a scale. These surveys may also include open-ended questions to gather additional feedback and insights. A higher NPS indicates greater customer satisfaction and loyalty, as well as a higher potential for customer referrals.
Monitoring and improving NPS is crucial for businesses aiming to increase customer loyalty and satisfaction. By analyzing the data gathered through NPS surveys, companies can gain valuable insights into customer sentiment, preferences, and areas of improvement. Based on these insights, businesses can then develop targeted strategies to enhance their customers’ overall experience and strengthen their brand reputation.
By prioritizing NPS and consistently working towards improving it, businesses can foster stronger customer relationships, increase customer retention rates, and drive sustainable business growth. NPS serves as a powerful tool for understanding customer experiences, gauging satisfaction levels, and driving positive word-of-mouth referrals.
Average Session Duration
Average session duration is a crucial metric that measures the amount of time visitors spend on a specific page or landing page during a single visit. Tracking session duration provides valuable insights into user behavior and content performance on your website.
When visitors spend more time on your site, it indicates that they are actively engaged with the content and finding value in it. Longer session times are a strong indicator of website engagement and user interest. By analyzing the average session duration, you can identify the topics and features that resonate most with your target audience.
Google Analytics is a powerful tool that automatically tracks session duration, allowing you to assess user behavior and make data-driven decisions to optimize your website. By understanding how users interact with your content, you can create new and relevant content that encourages longer session times and increases overall engagement on your website.
Increasing the average session duration is a key goal for businesses aiming to improve user experience and maximize the value visitors derive from their website. By providing valuable, informative, and engaging content, you can create a positive user experience that encourages visitors to spend more time on your site, leading to increased conversions, higher engagement, and improved search engine rankings.
“The longer visitors stay on a page, the more likely they are to consume all the available information and engage with your brand.”
Enhancing Average Session Duration:
- Create high-quality and relevant content that addresses the needs and interests of your target audience.
- Improve website navigation and internal linking to guide visitors to related resources and keep them engaged.
- Optimize your site structure to ensure easy navigation and seamless user experience.
- Regularly analyze user behavior and content performance using Google Analytics to identify areas for improvement.
By implementing these strategies, you can improve the average session duration, boost website engagement, and ultimately increase the likelihood of conversions and achieving your business goals.

Customer Satisfaction Rating by Channel
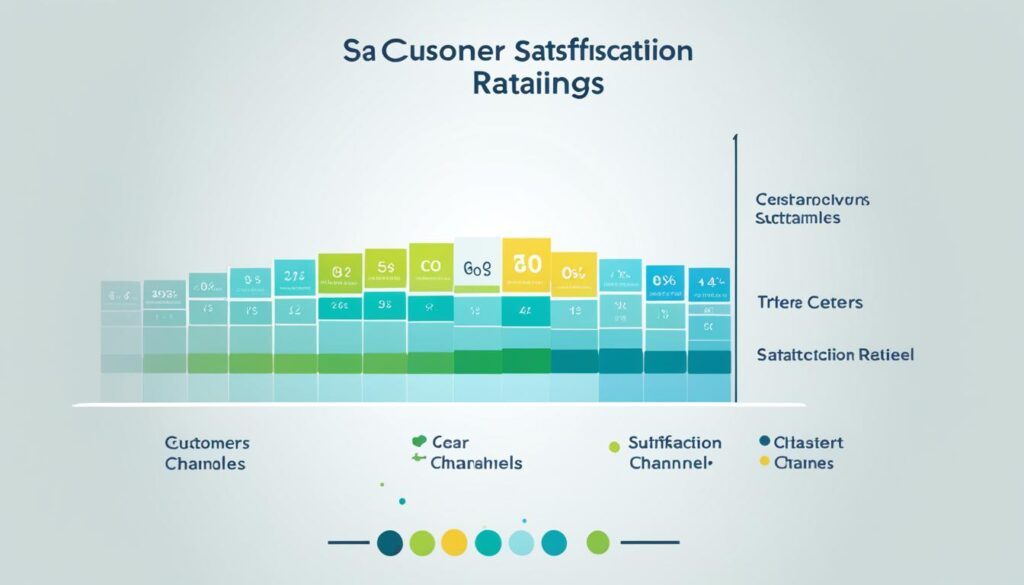
Customer satisfaction rating by channel is a crucial metric for businesses looking to enhance the overall customer experience and build stronger relationships. By assessing how satisfied customers are with their experiences across different customer service channels, companies can gain valuable insights into customer preferences and identify areas that may require improvement.
One effective way to gather customer feedback and measure satisfaction is through surveys. By asking customers to rank their support experiences and provide feedback on specific interactions, businesses can obtain valuable data that helps them understand which channels are meeting customer needs and which may need enhancements.
An important tool in measuring customer satisfaction is the Customer Satisfaction Rating (CSAT). This metric allows businesses to gauge customer satisfaction levels by channel, providing a clear picture of customer preferences and areas for improvement. The CSAT survey questions can be tailored to address specific aspects of the customer support experience, such as response time, problem resolution, and overall satisfaction.
Understanding customer preferences and satisfaction levels by channel enables businesses to optimize their customer service strategies. For example, if customers consistently rate phone support highly, a company may want to allocate more resources to that channel or improve the training of their phone support agents. Conversely, if customers rate email support poorly, the company can allocate resources to improve the responsiveness and effectiveness of this channel.
Creating a seamless customer experience across all channels is essential for building strong customer relationships. By continuously gathering and analyzing customer feedback, businesses can identify trends, address pain points, and make data-driven decisions to improve customer support and overall satisfaction.

Ticket Volume by Support Channel
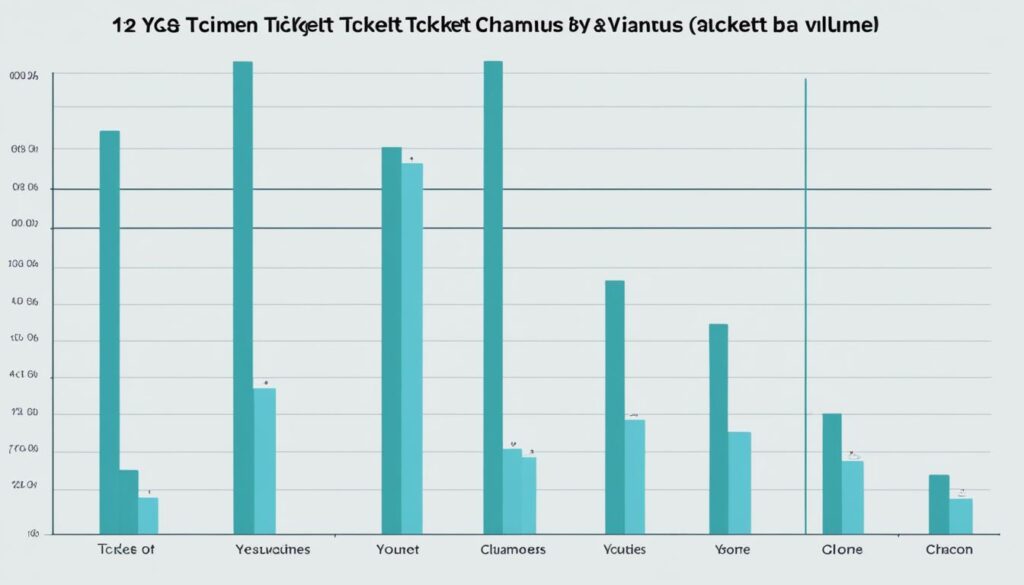
Ticket volume by support channel is an important customer engagement metric that allows businesses to measure the volume of customer inquiries or issues received through different support channels. Analyzing ticket volume by channel provides valuable insights into customer preferences and helps businesses identify the channels that have the highest customer engagement.
Understanding customer preferences for different types of queries enables businesses to optimize the efficiency of their support team and improve the resolution quality. By allocating resources and optimizing support channels based on customer preferences, businesses can enhance customer satisfaction and drive better customer engagement.
Social media monitoring tools can also play a role in tracking customer feedback and engagement on social platforms. This allows businesses to capture customer inquiries and issues posted on social media and respond promptly, further optimizing customer engagement on these channels.
By monitoring and analyzing ticket volume by support channel, businesses can make data-driven decisions to optimize their support strategy, allocate resources effectively, and enhance overall customer engagement.

“Understanding customer preferences for different types of queries enables businesses to optimize the efficiency of their support team and improve the resolution quality.”
Conclusion
Measuring customer engagement metrics is essential for businesses to understand and improve their relationships with customers. By tracking metrics such as conversion rate, pages per session, Net Promoter Score, average session duration, customer satisfaction rating by channel, ticket volume by support channel, and social media engagement, businesses can gain valuable insights into customer engagement levels and optimize their marketing and customer service strategies.
Monitoring and improving these metrics can lead to enhanced customer satisfaction, loyalty, and overall success in connecting with your target audience. The conversion rate helps evaluate the effectiveness of your campaigns and measure the value customers are getting from their interactions. Pages per session gives insights into user engagement and website performance, while Net Promoter Score measures customer loyalty and their likelihood to recommend your brand to others.
The average session duration helps identify content that resonates with your audience and drives higher engagement, while customer satisfaction rating by channel allows you to understand which channels are meeting customer needs and require improvement. Analyzing ticket volume by support channel helps optimize your support team and improve resolution quality, while social media engagement provides insights into customer feedback and preferences.
By focusing on these customer engagement metrics and continuously monitoring and improving them, you can strengthen your relationships with customers, enhance their satisfaction, and drive success in connecting with your target audience.
FAQ
What is the conversion rate?
The conversion rate is a customer engagement metric that measures the percentage of people who complete a desired action tied to a campaign goal. It can be calculated by dividing the total number of conversions by the total number of visitors or sessions and multiplying by 100.
How do I measure pages per session?
Pages per session is a customer engagement metric that measures how many pages a user clicks through on a website during a single visit. It can be tracked using Google Analytics and provides insights into user engagement and website performance.
What is the Net Promoter Score?
The Net Promoter Score (NPS) is a widely used customer engagement metric that measures customer loyalty and their likelihood to recommend a brand to others. It is typically assessed through a survey that asks customers to rate their likelihood of recommending the brand on a scale. A higher NPS indicates greater customer satisfaction, loyalty, and potential for customer referrals.
How is average session duration measured?
Average session duration measures the amount of time a website visitor spends on a specific page or landing page during a single visit. It helps marketers identify the topics and features that resonate with their target audience and can be tracked automatically using Google Analytics.
Why is customer satisfaction rating by channel important?
Customer satisfaction rating by channel is a metric that measures how satisfied customers are with their experiences across different customer service channels. It helps businesses identify which channels are meeting customer needs and which may require improvement, resulting in an enhanced overall customer experience and stronger customer relationships.
How can ticket volume by support channel help my business?
Ticket volume by support channel measures the volume of customer inquiries or issues received through different support channels. By analyzing ticket volume by channel, businesses can identify the channels that have the highest customer engagement and understand customer preferences for different types of queries. This information can optimize the efficiency of the support team, improve resolution quality, and inform marketing campaigns based on customer channel preferences.
